Table 1 reimagined
Time to reimagine Table 1
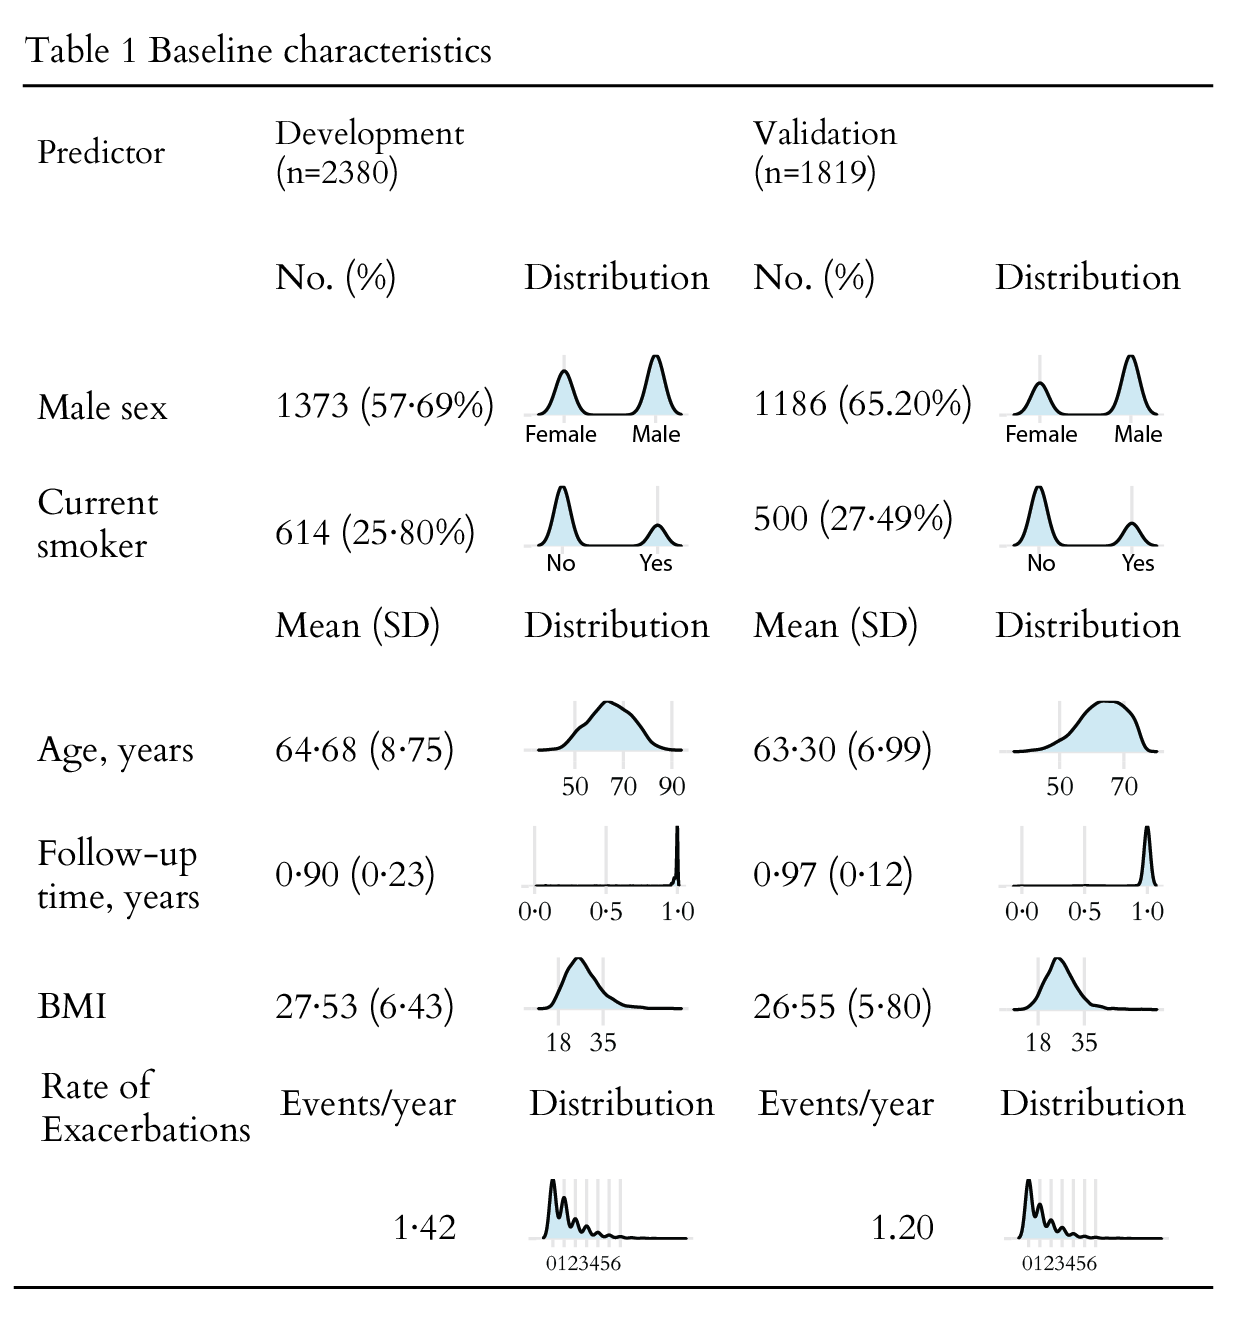
Clinical studies often include a Table 1 which summarized the baseline characteristics of the study population. The goal here is to give readers a sense of what the population looked like. For continuous variables, it is customary to report the mean and the standard error (or standard deviation). However, this is only useful if the data is normally distributed, which is often not the case.
We tried to reimagine Table 1 to give the reader a better grasp of the distribution of baseline characteristics.