COPD exacerbations
3D plot showing number and severity of predicted lung attacks.
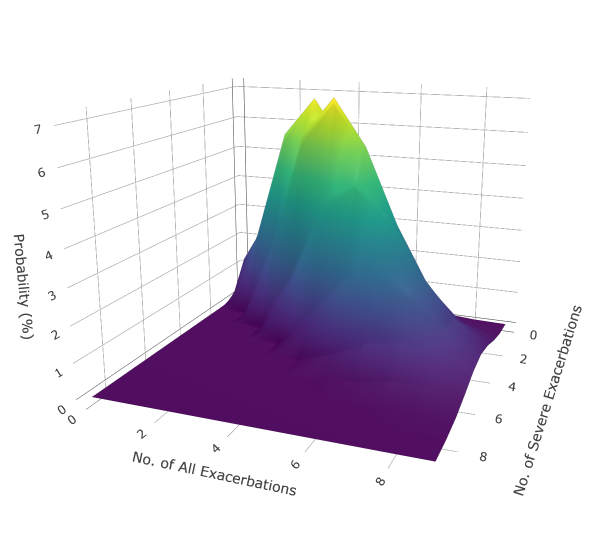 3D plots are useful to visualize multi-dimensional data. In this example, a surface plot was used to visualize the probability distribution of all possible outcomes for a particular patient. Although many of us may not be used to interpreting 3D plots, they might be helpful in highlighting key information that might be lost otherwise. In this particular example, it can be immediately appreciated that two particular outcomes that are more probable than the rest.